Time Series Data is the the new Big Data
On 22 November 2014, the NoSQL matters conference took place in Barcelona at the Casa Convalescència, which is doubtless one of the most beautiful locations for a conference! The Casa was declared a Historical Artistic Monument in 1978, and a World Cultural Heritage Site in 1997, and these great halls are a great place for great speakers.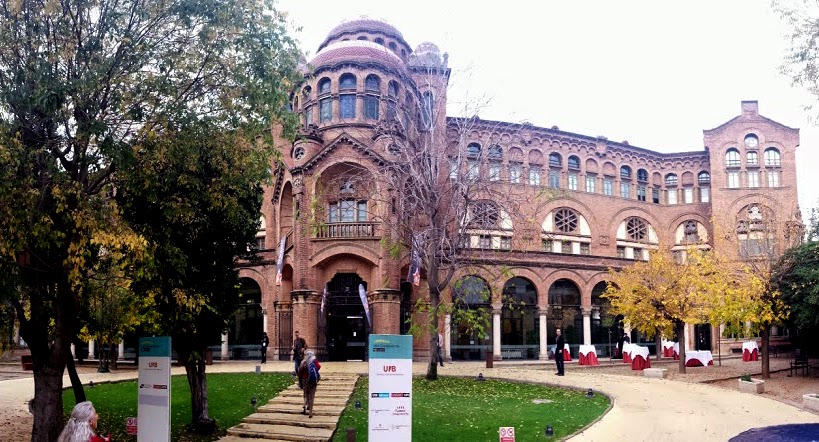
This year, Ellen Friedman (@Ellen_Friedman) and Ted Dunning (@ted_dunning) were among them, and it is always a pleasure to listen the both of them pointing out actual society-changing trends in modern big data and NoSQL technologies. Ellen Friedman held the keynote, and their common topic was the necessity of processing time series data. Ellen Friedman has experience in a wide range of scientific fields. She is a committer for the Apache Mahout project, and contributes to Apache Drill. Ted Dunning is also involved in various Apache projects, as a committer and PMC member of Mahout, ZooKeeper and Drill, and is also mentor for Apache Storm, DataFu, Flink and Optiq. Both are working for MapR at the moment. MapR also held a training at the training day of NoSQL matters Barcelona.
There is (time series) data everywhere
Time series data processing and real time data analysis are a big issue nowadays, and topic of many of the last years NoSQL conference talks. The world gets more and more distributed, there are sensors everywhere, reporting thousands of measurement each second. The so called Internet of Things (IoT) produces an enormous amount of data every day: From smart meters in plants to smart shirts for athletes, almost every object in our everyday life has the ability to emit data. But how to store and query the data efficiently? And first of all: Why do we need all the data and what to with it?
The history of Time Series Data
Time series are an old idea, the city of Barcelona stores data about the citizens extensively since the 13th Century. An impressive example of a crowdsourced, open source and big data analysis project dates back about 170 years: Matthew Fountaine Maury, a mariner with the United States Navy in the mid-19th century, who was forced to desk-work after a leg injury left him unfit for sea duty, devoted his time to the study of navigation, meteorology, winds, and currents. As officer-in-charge of the Navy office in Washington, DC, Maury became a librarian of the many unorganized log books and records in 1842. There, he sought to improve seamanship through sorting the available, yet unorganized information in his office, analyzing roughly one billion data points by hand!
His thorough analysis resulted in his wind and weather charts. Maury made them widely available by sharing them among other Captains, on the condition that they report and share their own logs back to his office, therefore providing a constant data base to continuously improve his charts. In 1848, Captain Jackson was able to shorten his journey from Baltimore to Rio de Janeiro by more than a month by exploiting Maurys charts. After that Maurys charts spread among Captains, and in 1853 the data was the basis for the fastest voyage from New York to San Francisco, made by the Flying Cloud under the female navigator Eleanor Creesy – a record that lasted for over a hundred years.
See with your eyes closed – think with your eyes open
This example does not only show how time series data analysis can be used for informed data-driven decisions, it also shows that thinking about your use-cases and data is important. What is it you want to achieve, and what does your data tell you? Ellen Friedman proposed to close your eyes for a moment or two, and think about the data you gathered, look at it the right way and let it tell you what is in it. With your eyes open again, try to find out more about it, search for trends and hidden secrets – it is basically like a crime story. Maurys vision of the charts was eyes closed seeing, his keen observation and focus on the details eyes open thinking.
Big data in the blink of an eye
Todays sensors emit much more data than Maury had available to take into account for his charts. Thousands to millions of data points are collected by sensors, smart meters, RFIDs and many more every second of every day. In modern power plants almost every part, from pumps to valves, constantly sends data about its state, temperature, processed fluids and many other information. All this data is valuable and offers enormous opportunities: Critical states that might not have been taken into account, could lead to failure and thanks to being able to detect unusual data values reported from the sensors, life threatening situations can be detected before they occur. Correlations of events, deducible from the events of the time series of different parts can help to understand situations leading to failures, and therefore reduce risks in the future. Prediction of material fatigue and failure behavior could be achieved as well as classification and anomaly detection. In general, in a wide range of events ranging from natural sciences to monetary businesses to marketing to medical care
- prognostication
- introspection
- prediction and
- diagnosis
might get possible.
How to use time series databases
Now that we understand why time series data is valuable, we are interested in how to process them? Friedman and Dunning nicely explained the necessity of dedicated time series database technologies. Usually, time series data is very simple: A (static) data source emits time/value pairs, and thats basically it. If you have
- a huge amount of (time series) data, and
- queries mostly based on time or time ranges
you might think about using a time series databases (TSDB) that enables you to efficiently analyze the data.
Why not use a relational database system?
Interestingly, data storage is less of a problem than efficient data retrieval. A traditional relational database system (RDBMS) does not suffice when it comes to efficient time series data retrieval. The overhead generated by unused transaction management and query optimizers, together with the row-by-row retrieval forced by star schemas, does not allow for efficient response times. And again, scaling of an RDBMS is hardly possible. The solution are specialized TSDBs, based on open source NoSQL technologies, and a smart data model to overcome said deficiencies. As a foundation, the distributed file system of Hadoop is appropriate, backed by the NoSQL wide column store Hbase (or MapR-DB). The clever combination of semi-structured wide columns with blob compression techniques can lead to rates of up to 100 million data point per second on a 10 nodes, good equipped, cluster with 4 nodes active. Quite an impressive data rate. The usage of in-memory structures enables fast computation, and write-ahead logs ensure reliable durability of the database. A time series database system is implemented with OpenTSDB, based on MapR-DB and Hadoops HDFS. On a 4-node MapR-DB cluster, 30 million data point can be retrieved, aggregated and plotted in less than 20 seconds.
Where to go from here?
What can we do with all this data, why should we collect and keep it, and what can we learn from it? There is a variety of use cases, including machine learning techniques, that classify data or detect anomalies. There are good algorithms available, and the combination of open source technologies backed by Hadoop make the Hadoop ecosystem applicable: That means the availability of Apache Mahout for machine learning, Apache Spark for data analysis (at the moment preferable over Hive), or Apache Drill for data analytics.
And this is how NoSQL changes society
Friedman and Dunning pointed out how modern society’s Internet has reversed the flow of data: Instead of demanding data from servers, applications now often push (time series) data into databases. NoSQL and open source technologies allow for the analysis of these data, hence enabling society to take advantage of all the data gathered. Maury gave a good example, and his proceeding hopefully becomes a widely accepted and widespread way to gather and share data for data analytics. An example is the Aadhaar-project that aims for identification without regard to cast, creed, religion or geography in India to ensure better welfare services, and that runs on the NoSQL database MapR-DB. Let’s use the potential and power of the technologies together for the better good of society.
Further readings
As this blog can only give a brief motivation and introduction into the topic of times series databases, the interested reader who likes to get deeper insights is referred to the literature and the references therein. 😉
- Time series databases by Ted Dunning and Ellen Friedman
- Practical Machine Learning: A New Look at Anomaly Detection by Ted Dunning and Ellen Friedman
- Practical Machine Learning: Innovations in Recommendation by Ted Dunning and Ellen Friedman
- The talks by Friedman and Dunning on the topic given at NoSQL matters in Barcelona
Or just download some software and try it out yourself:
Tobias Schneider
Thanks for sharing! Great artical, great motivation.