Monitoring – NIH style
Not being a pure Developer but more of a DevOp brings all sorts of interesting problems. When you not only sell software but are also included in the whole life-cycle you get a different view on things.
So there you have it – the production deployment of some software running at the customers site exhibits problems and will be restarted by the support. This rarely leaves time to really analyze what went wrong, except a postmortem analysis. This blog post is about ideas on how to be a little pro-active in gathering information before and after things go horribly wrong.
There are many ways to monitor a system. Nagios allows for monitoring the general health of a system. Something like Ganglia can give an overview over performance values. Graylog2 can be used to monitor logs. In the Java world Jolokia provides a good view to JMX and thus to the JVM. Specialized Software like the JBoss RHQ allows monitoring of the middleware and applications. Running applications on virtual servers provides additional management tools to monitor running virtual instances. A configuration management software like Puppet might provide additional information. All this to detect irregularities in the system or to gain insight into a specific set of events.
So there is a huge variety in what to monitor, how to go about it, how notifications work, how much information can be gained.
So we have all those nice tools at our disposal – so – what is wrong?
- No direct control over production systems.
- Irregular failures.
- Postmortem analysis hard/impossible due to missing information.
- There is never enough time TM.
So, lets work with what we have – and do it with the least amount of work and hassle possible for everyone involved.
Prototype
The problem in the production deployment:
- A memory leak in a Java application deployed in a JBoss 4 at (seemingly) random times at different sites.
- No clue in the available information (logfiles) indicates a direct problem
We need more information. Optimally, it would be nice to see if we can detect the problem before the customer does and warn the support staff of the production site. Failing that, we at least have more information to work on during analysis.
General idea:
- Get memory status from running application small intervals and save for later.
- Plot the information.
With a base JBoss 4 we can get access to JVM information via /status?XML=true (in a few variants) and in /web-console/ServerInfo.jsp. Gathering the information for later is straight forward, write a 3 line shell script running in the background saving the output of JBoss to disk.
while true; do
curl -n $url -o "html_src.$host/$(date --rfc-3339=seconds).html"
sleep $polltime
done
We pretend some time has passed and the problem on the production machine occurred again. We need to aggregate the collected information. We iterate over a set of files and just grab the information we need to save it nicely structured in a CSV file for post-processing. We need a format our plotting application can read easily.
date,Free_Memory,Max_Memory,Total_Memory
"2013-01-10 00:00:09+01:00",499292808,2067988480,714670080
"2013-01-10 00:00:19+01:00",485999352,2067988480,714670080
"2013-01-10 00:00:29+01:00",579714128,2067988480,714670080
"2013-01-10 00:00:39+01:00",565887928,2067988480,714670080
And the conversion script from XML to CSV:
for filename in html_src.$host/*; do
stat="$(xmllint --format $filename | sed -n
's/.*memory.*free="\([0-9]*\)".*total="\([0-9]*\)".*max="\([0-9]*\)".*/\1,\2,\3/p')"
echo "\"$(basename -- $file .html)\",$stat"
done
Feeding that into e.g. OpenOffice by hand isn’t hard but a little more hand-holding would be nice for convenience. Lets create a PDF document and let our document viewer handle the reload when the file changes. There are choices when it comes to generating graphs – my personal favorite is R, a tool for statistical computing.
!/usr/bin/R
require(forecast)
options(digits.secs=6)
args <- commandArgs(trailingOnly = TRUE)
r2 <- read.csv(file=args[1],head=TRUE,sep=",")
r2$date = as.POSIXct(r2$date)
r2$Free_Memory = as.numeric(r2$Free_Memory)
r2$Max_Memory = as.numeric(r2$Max_Memory)
r2$Total_Memory = as.numeric(r2$Total_Memory)
r2$Free_Memory_avg <- ma(r2$Free_Memory, 12)
r2$Max_Memory_avg <- ma(r2$Max_Memory, 12)
r2$Total_Memory_avg <- ma(r2$Total_Memory, 12)
r2$used <- r2$Total_Memory - r2$Free_Memory
r2$used_avg <- ma(r2$used, 3)
maxmem <- (max(r2$Max_Memory))
pdf("ram.pdf")
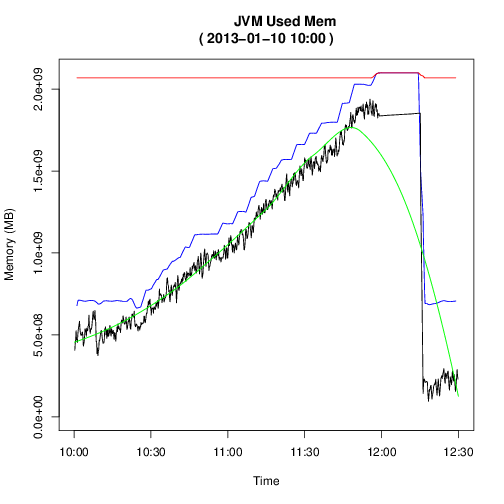
plot(range(r2$date), range(r2$Max_Memory), type="n",main=paste(args[2],
"JVM Used Mem\n(",args[3],")"),ylab="Memory
(MB)",xlab="Time",ylim=c(50,maxmem))
lines(r2$date, r2$Total_Memory_avg, type="l",col="blue")
lines(r2$date, r2$Max_Memory_avg, type="l",col="red")
lines(r2$date, r2$used_avg, type="l",col="black")
dev.off()
This does nothing more than read the CSV file, some data type conversions, figuring out some mins and maxes, calculating a moving average so we get a smoother view and plot a few lines showing us the memory behavior.
With a endless loop calling R with the above script… we now have replicated what other tools would already have done for us, collect information, plot it in real time. Again. As with other tools (Graphite comes to mind) we can plot arbitrary time ranges, zooming in weird behavior, as shown above, merely by generating the CSV file differently. This is all very low-tech. We did not write any application code, we merely glued existing technology together.
So now we have more information:
- We actually have a few different kinds of bad memory behavior:
- A case where over the course of 2-3 hours the memory fills up.
- A spike where the memory instantly goes to max.
- A continuous memory leak.
Having timings on when things actually start to go wrong is – quite plainly – awesome. Having Nagios alert on resource usage above a specified water mark can be quite valuable (in the first and third case mentioned). But does not as such help with the second one (except to tell you that the application is dead-ish).
The happy Ganglia/RHQ user will ask: But.. why again?
The programmer with a mind for patterns, elegance and performance will point to the mindless hundreds of megabytes filling up my hard-drive space while this is running. (Not to speak of the lack of scheduling which leads to gaps in data-collection when one JBoss stops responding in a timely manner.)
But that is exactly what I want. I not only want to know “uh oh.. I think your application is dead” (Nagios), not only “OK, this is how your memory looked the past 5 hours” (Ganglia) – I want enough context for later analysis.
In this case, the JBoss status page not only contains pure JVM information but also the HTTP requests, how long they are already running and the (GET) request parameters. So I can also answer the question “how did the JBoss look like before it went all wonky” and have more data available to analyze later – such as hanging user-requests.
So what did we do here.
- Easily (for the creator) adaptable tool-chain for monitoring and data gathering
- We used an obscure set of tools (Bash, curl, R, xmllint, filesystem as DB, pdf viewer with something like inotify).
- There is “yet another tool”
- The tool needs regular maintenance (truncating old data)
- The tool is very “specific” – it is too small to even attempt to be “generic”
- But, the same mechanisms can be used to monitor something completely different
- And: does not only gather numeric data
This of course should not supplant your existing monitoring infrastructure, all insight gained should be properly integrated. This is more a way of thinking, of developing an idea – if you have more, other, opposing ones, please do share!
Jonathan Buch
As we also got a tweet from another person asking whether we found the leaks - yes, we did find those leaks (in this specific case one of them via <a href="http://visualvm.java.net/" rel="nofollow">jvisualvm</a>, the others by doing a statistical analysis on logfiles and going through code via toothpick).
But even that is slightly missing the point (I ignore your marketing speech). By the time you (meaning software maintenance) arrive, the software is already gone - you are not able to save a memory-dump on oom - you are not able to reproduce it on stage nor dev.
Where is the fun in reproducable things!
Ivo
We definitely have one. We find all your memory leaks for you. Down to the line of code where the leaked objects were created and where the references are currently hanging. Next time give http://www.plumbr.eu a try and you avoid some of those all-nighters when tracing down a leak.